|
:::
:::
:::
:::
|
| |
 |
|
| ::: ST1 ::: |
|
| A device for measuring
thermostimulated current in insulators |
| |
| |
| ST1
The device is designed for measurement of thermostimulated current (or thermostimulated
depolarization) in dielectric materials.
The measurements are performed in a heating cell equipped with the help of
high-sensitive system of original design.
The device is controlled from a host PC. The control software provides a possibility
of user-programmed heating.
Connection of the device with host PC via USB port.

|
|
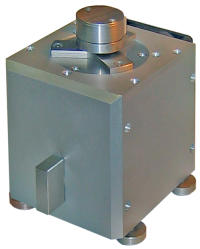
A measuring unit of the device for thermostimulated current testing ST1 |
| |
|
| Measuring
modes : |
|
- Constant heating current;
- Heating with the heating current programming;
- Heating to the preset temperature. |
| Recorded
diagrams: |
|
I=f(T), I=f(t), T=f(t), I=f(t)
+ T=f(t) |
| Sample size: |
|
Diam. 15 mm, thickness up to 10 mm |
| Range
of the measured current: |
|
+200 pА |
| Maximum temperature
of the cell heating: |
|
not lower than +400 °C |
| Sample
heating temperature: |
|
up to 220 °C |
| Heating rate: |
|
Adjustable |
| Maximum
heating current: |
|
1.7 A |
| Cooling
system: |
|
Embedded air fan |
| Overall
sizes: |
|
Measuring unit - 130x145x190
mm (w-d-h), weight 2,6 kg;
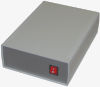
Control electronic unit - 200x290x82 mm (w-d-h), weight 2 kg |
| Power
consumption : |
|
not more than 240 W |
| Управляющий
компьютер: |
|
Not
less than Celeron® 1700, RAM 128 MB, HDD 40 GB, Windows®
XP SP2, USB port. |
| Software: |
|
A specialized control
software included. |
|
 |
| ::: |
Measuring
unit. |
| ::: |
Control
electronic unit with a set of interface and connecting cables. |
| ::: |
Control
software (for Win32 PC). |
|
|
| |
| ::: SOFTWARE ::: |
| ST1 :::
General information :::
Features ::: Delivery
set ::: Software
|
| |
| 
Control software for the device ST1 is
a 32-bit Windows application.
It runs under Windows XP SP2 and higher operating systems.
The control software provides acess to all settings necessary for the device
operation as well as for control over the systems at measurements. Measured data
are displayed on a monitor and are plotted as diagrams.
Acquired data are saved in text files (with special header) and can be then
processed, visualised and analysed either with the program directly or with other
programs (e.g. MS Excel, SurfaceXplorer, etc.).
|
|
|
|
|